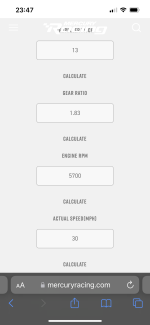
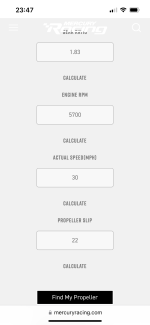
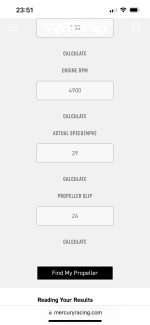
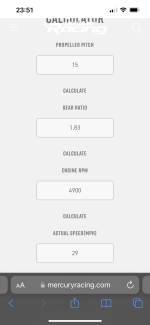
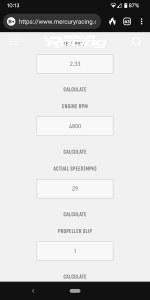
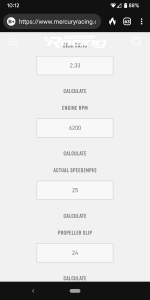
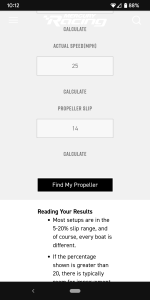
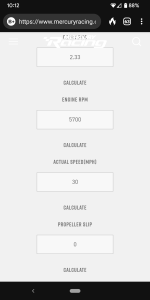
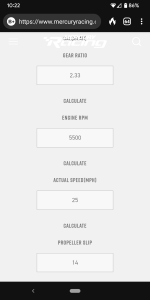
So just had a wee play with your numbers suggested above, with the 30 mph…5700rpm. Came out at 22% slip for me…assuming it’s the 1.83 gear ratio and 13” prop. Defo worth another run out to double check the data.All size numbers were verified on the prop as that was my first thought too!
My original numbers with boat having no extra test weight with the 13 pitch 4 blade was 5700rpm @ 30mph. Slip came out to zero I believe. Once I added weight that it will normally operate with that prop delivered 5500rpm @25mph.
I no longer have the 3 blade hustler 13 prop. I did the trade they have to get the 15.
The 13 pitch was 14" diameter. The 15 pitch is 13.75" diameter.

- Shop
-
Main Menu Find The Right Fit
-
-
Slide Anchor Box Anchors Shop Now
-
Back Fishing
-
View All
- Fishing Rods
- Fishing Reels
- Fishing Rod & Reel Combos
- Fishing Tools & Tackle Boxes
- Fishing Line
- Fly Fishing
- Fishing Bait & Fishing Lures
- Fishing Rod Holders & Storage Racks
- Fish Finders, Sounders & Sonar
- Trolling Motors
- Fishing Nets
- Fishing Downriggers & Acessories
- Fishing Outriggers & Acessories
- Fishing Kayaks
- Fish Cleaning Tables
-
-
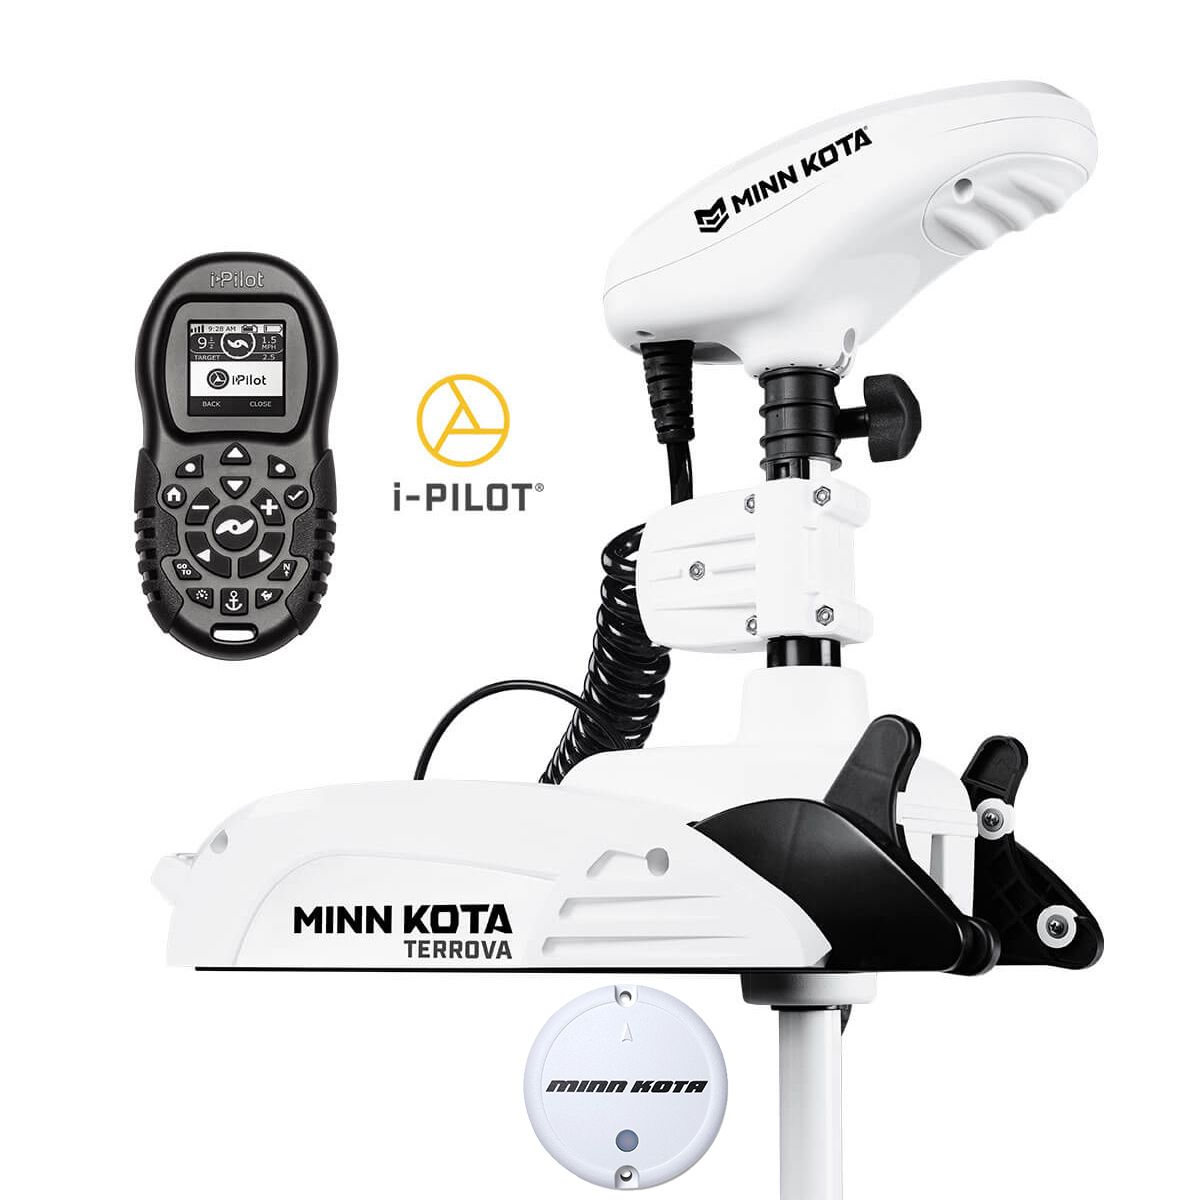
Minn Kota Riptide Terrova 80 Trolling Motor w/i-Pilot & Bluetooth Shop Trolling Motors
-
SportsStuff Great Big Marble Shop Tubes
-
Big Jon Honda 5hp Outboard Shop Outboards
-
Lexington High Back Reclining Helm Seat Shop Helm Seats
-
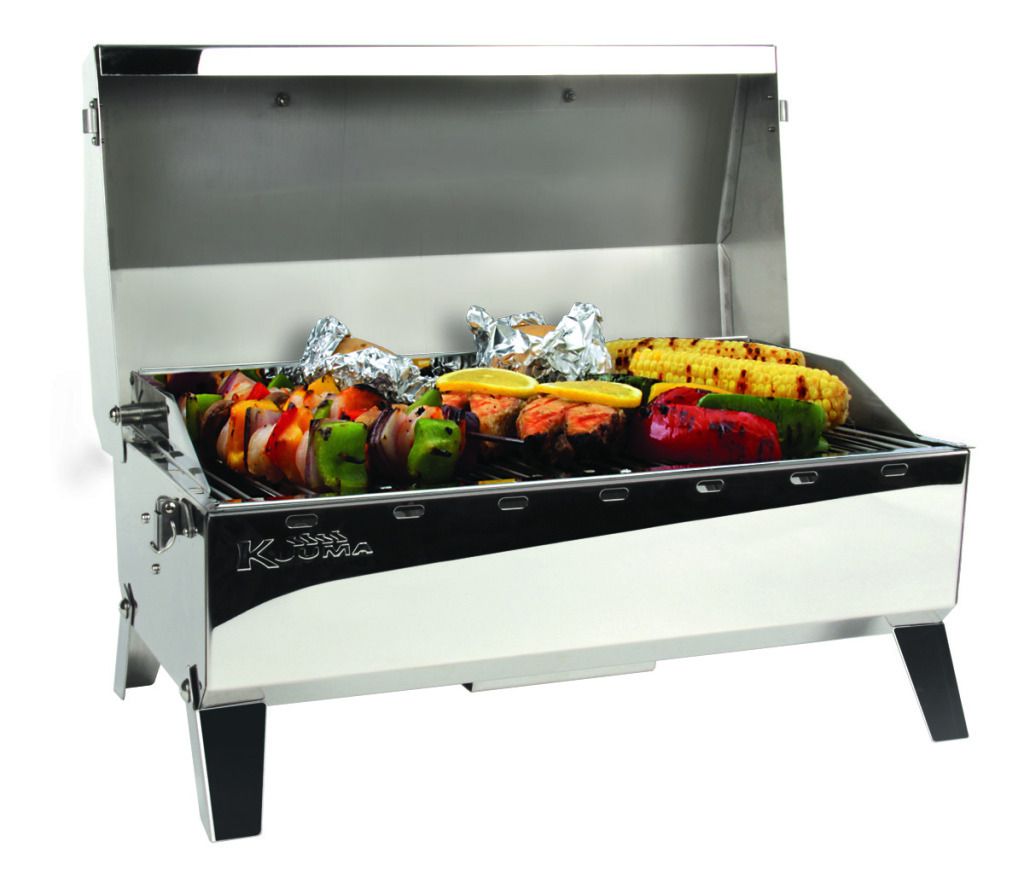
Kuuma Stow n Go BBQ Shop Now
-
Slide Anchor Box Anchors Shop Now

-
Back Electrical
-
View All
- Boat Wiring & Cable
- Marine Batteries & Accessories
- Marine DC Power Plugs & Sockets
- Marine Electrical Meters
- Boat Lights
- Marine Electrical Panels & Circuit Breakers
- Power Packs & Jump Starters
- Marine Solar Power Accessories
- Marine Electrical Terminals
- Marine Fuse Blocks & Terminal Blocks
- Marine Switches
- Shore Power & AC Distribution
-
-
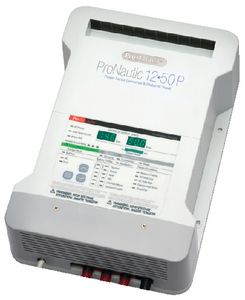
ProMariner ProNautic Battery Charger Shop Marine Battery Chargers
-
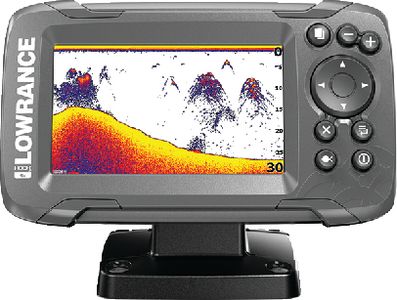
Lowrance Hook2-4 GPS Bullet Skimmer Shop GPS Chartplotter and Fish Finder Combo
-
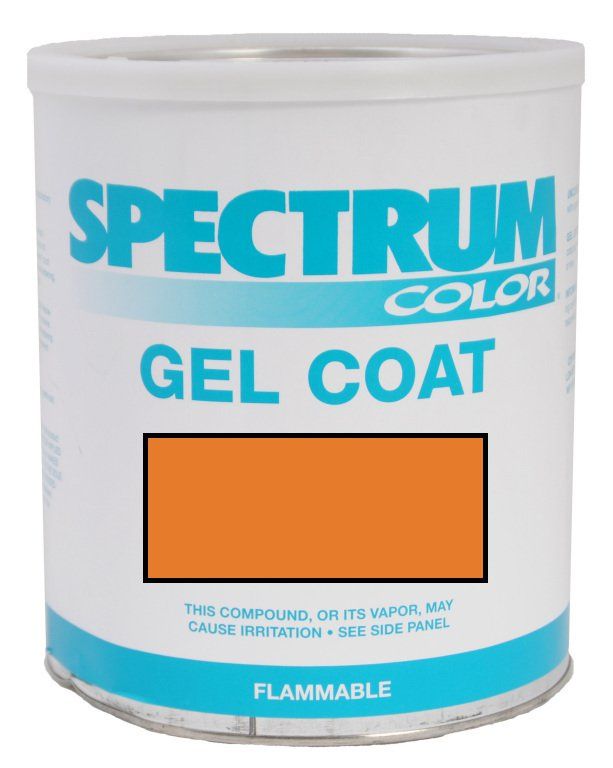
Boston Whaler, 1972-1993, Boat Gel Coat - Spectrum Color Find your boats Gel Coat Match
-
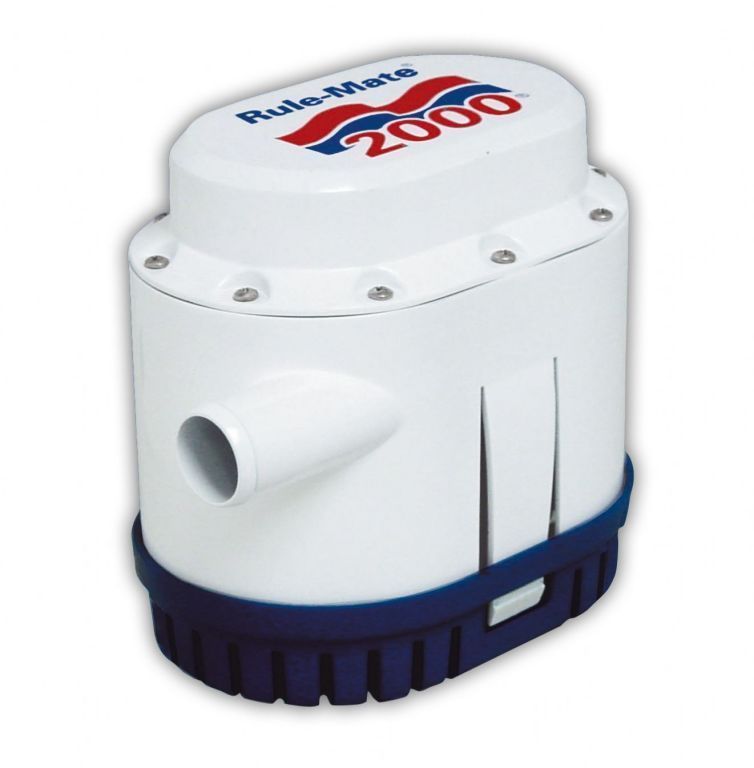
Rule 1500 GPH Automatic Bilge Pump Shop Bilge Pumps
-
Back Trailering
-
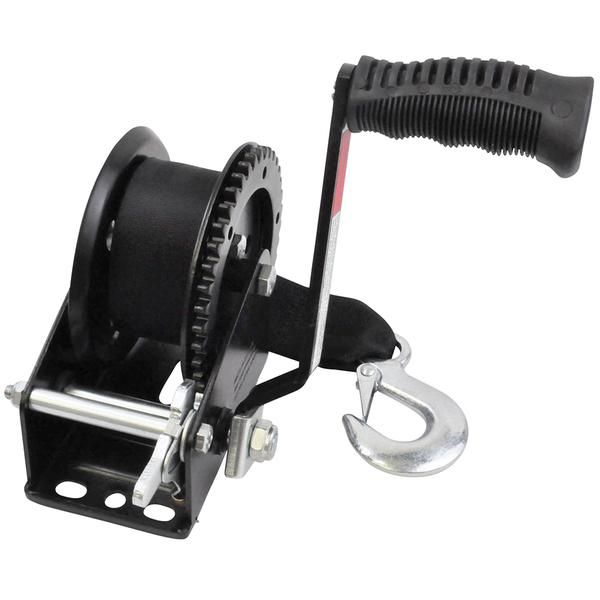
SeaSense Trailer Winch Shop Trailer Winches
-
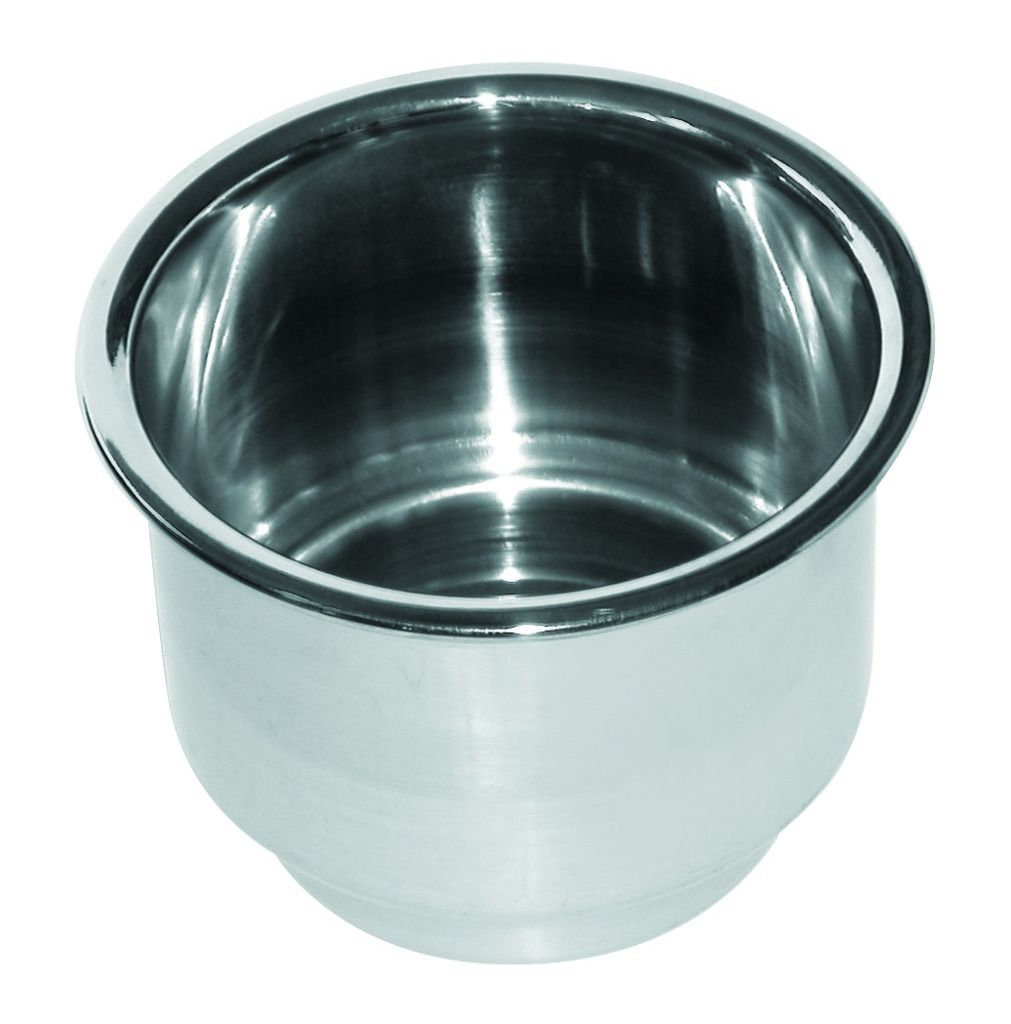
Seadog Stainless Steel Cup Holder Shop Drink Holders
-
Slide Anchor Box Anchors Shop Now

-
- Boats for Sale
- Community
-


